|
2005-12-13
NEW York cotton futures ended slightly lower as the market digested news in a government crop report of robust demand and an enormous crop in 2005/06. Attention in the market was focused on the US Department of Agriculture's monthly supply/demand report which showed the US cotton crop hitting a record 23.7 million (480-lb) bales and the world ending stocks expanding to 50.92 million bales, up from last month's 50.18 million.
The USDA increased its estimate of China's cotton imports to a whopping 16.5 million bales versus last month's forecast of 16 million and pegged world cotton consumption at a massive 114.85 million bales, against last month's 114.4 million. Markets more or less discounted the huge supplies and focused more on the kind of demand the USDA projected in China, the world's largest consumer of cotton, and in India and Pakistan, where the crop has suffered from poor weather.
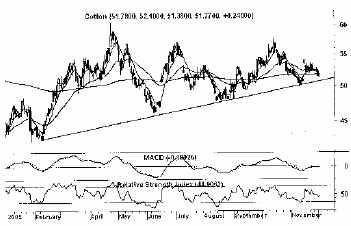
The now Active March contract is still stuck in a range and is set to test the trend line support point at 50.95-51.00c levels. No change in view. As mentioned earlier, the bigger picture weekly charts continue to show a bullish triangle pattern in the making and, therefore, it is difficult for prices to fall lower sharply.
As long as price stays above 50.75-51c levels, expect cotton futures to rise higher again. Only a daily close below 48.25c will signal bearishness in cotton futures. On the other hand, a move above 55c directly can take prices higher towards recent resistance at 58.25 or even higher towards 60c.
Elliot wave analysis points to a corrective pattern in progress, ending at 41.71c and a new impulse still in progress. The corrective second wave of that impulse looks to have ended at 46.10c. Daily close below 48.25c will change this outlook and lead to a sharp fall lower. RSI is in the neutral zone indicating that it is neither overbought nor oversold.
The averages, in MACD are above the zero line in the indicator suggesting bullishness in the bigger picture.
Current prices are above the short-term average of 8-day EMA at 52.08c and the 34-day EMA is at 52.40 cents. Therefore, look for cotton futures to test the support levels and rise higher.
Supports are, at 50.25, 49.10 & 48.25 cents. Resistances at 53.55, 54.05 and 55 cents respectively.
Business Line
|
 浙公網安33010602010414